40 Channel Color Organ Project
This project employed a EVAL-ADAU1467Z analog digital signal processor board, programmed with 40 very sharp bandpass filters programmed in SigmaStudio. Each was tuned to the frequency of one note on the A-440 scale, from E2 (82.4 Hz) to G5 (784 Hz). An ESP32 read the output registers from the ADAU1467 chip every 20 msec and broadcast the set of samples to the other ESP32s using the ESP NOW protocol. A sixth ESP32 is programmed as a webserver, to serve up a web application providing a set of 24 variable parameters to the display processors via WebSockets.
The filter samples are processed to make interesting visual display using knowledge of the prominent musical notes being played at any given time. Here’s George Winston from a 1983 Seattle FM Radio concert:
The display consists of twenty 3-foot long 1″ diameter clear acrylic tubes, each containing two strips of 52 LEDs, one facing left, the other right, inside the tube. Clear acrylic beads are used as diffusers.
The parameters include things like fade values, brightness,and smoothing (how responsive the display is). The display method I found most interesting was to use the strongest note being played at any given time as the display color. That’s why, in the George Winston performance, it’s green for a while at the beginning.
Back in college in the 80’s I built a 6-channel color organ using analog bandpass filters and strings of colored Christmas lights. This is several stages advanced from that!
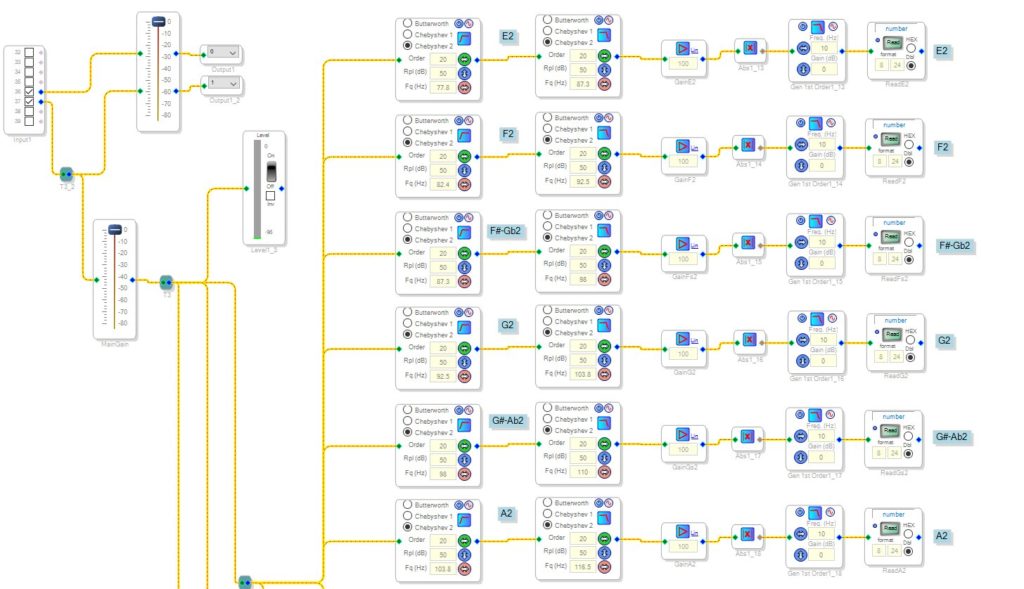
Here is a portion of the SigmaStudio design for the filters:
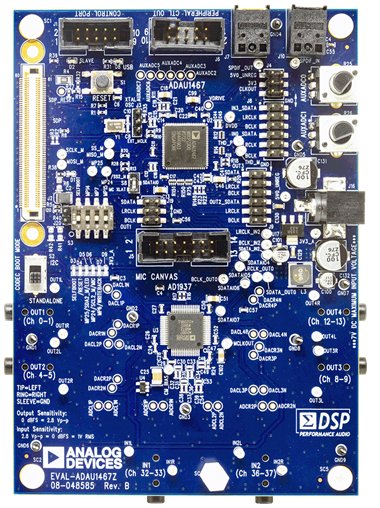
The EVAL-ADAU1467Z board looks like this:
The control program (HTML/JavaScript) delivering commands by WebSockets looks like this:
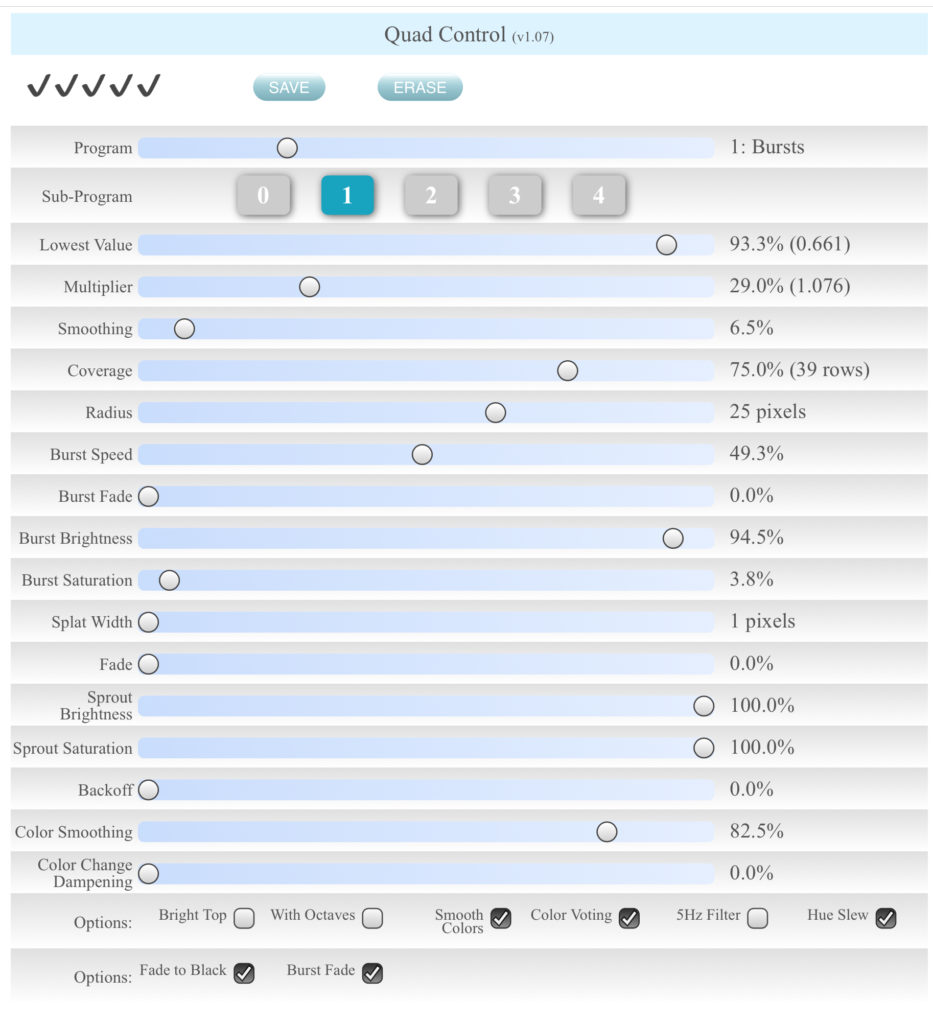
A number of different “programs” are available, each with up to 5 preset parameter set values. This one is called “Bursts.” The “bursts” are displayed at the tops of the bars, at variable intensity, radius, speed and color saturation.
Here are some other examples. Program 0 is used as a basic test, and just shows the outputs of each of the 40 filters. In this example, a sine wave is used as a test signal, to show the response of the 40 filters. Each of the 12 notes of the musical octave is displayed in a different color, starting with red at the low E.
The next example shows some example display settings. Starting at about 1:00 you can see the “burst” feature (the white “explosions” that emanate from the tops of some of the peaks).
Enjoy!